


Examining the data closely reveals an uneven performance in the market for low-rise houses and condos across the five regions of the Greater Toronto Area (GTA). Similar to the varied performance of housing markets across Canada, as discussed in a recent interview with BMO's Robert Kavcic, different regions and types of houses within a metropolitan area also exhibit diverse trends.
In this month's data analysis, we will delve into how the market for low-rise houses and condos is faring across the GTA's five regions. The chart below illustrates the year-over-year change in sales for October 2023.
-560-wide.png)
Notably, condos in Peel experienced the most significant decline in sales, just under 20%, followed by houses in the Halton region with an 11% decrease. In contrast, condos in York are the only house type that has witnessed an increase in sales compared to last year.
A noteworthy observation is that most regions and house types saw sales volumes fluctuate within 5% of last year's levels. While the GTA experienced relatively soft sales last year, the substantial difference between this year and the last lies in the change in the number of homes available for sale or active listings.
Active listings across the GTA have surged by over 50% for all house types and regions, excluding a 38% decline in Halton condos. Suburban houses have witnessed the steepest increase in active listings, followed by condos in the City of Toronto.
-560-wide.png)
However, to comprehend the market balance in each area, it's crucial to examine the months of inventory (MOI).
-560-wide.png)
Despite Durham's houses seeing the most significant increase in active listings, it also boasts the lowest MOI, suggesting a more balanced and competitive market compared to other regions and house types.
Across all five regions, the condo market has a higher MOI than the house market, with the City of Toronto exhibiting the most significant difference between house types. Houses have a 3.4 MOI compared to condos at 5.8 MOI, indicating a slower condo market.
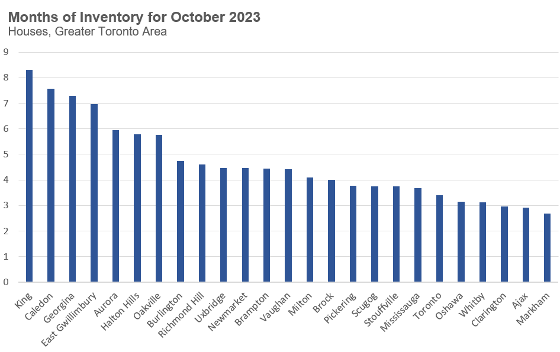
There is substantial variability in the MOI for houses across GTA municipalities. The chart below illustrates the October MOI for houses in each municipality. Far-reaching areas of the GTA, such as King, Caledon, Georgina, and East Gwillimbury, show a high MOI of 7 to 8, while areas closer to Toronto's east-end suburbs, including Oshawa, Whitby, Clarington, Ajax, and Markham, have around 3 MOI.
Considering how prices have changed over the last year, it's essential to note that GTA prices have been trending downward for the past four months. Therefore, regions and house types showing year-over-year price increases do not necessarily indicate current upward trends but rather reflect that despite declining prices since spring, they remain higher than last year.
Interestingly, despite the surge in active listings and record-low demand for houses, average prices are still up year-over-year in four of the five regions. The key takeaway for buyers and sellers is that market dynamics are highly localized, and relying on aggregate trends for the Greater Toronto Area may not provide accurate insights for real estate decisions.
Feel free to reach out to Ann or myself with any questions you may have. We're here and more than willing to help you make the most informed real estate decision that aligns with your current situation. Your inquiries are valued, and we're dedicated to ensuring your satisfaction throughout this crucial decision-making process.
